
You must log in or register to comment.
Prices have gone up while portions, service, and even quality (as low as it already was) have gone down. When does “the free market” start improving things for customers instead of just shareholders?
Did the quality really go down? I don’t go to McDonald’s very often but I think the quality has improved a lot from what I remember it being in the 2000s/2010s. It’s still mostly unhealthy slop, but sometimes that’s exactly what you need.
Granted, I’m in Germany; I can’t speak for any other country’s locations
Germany has regulations for food that are much more demanding than those of the US, so there isn’t much that fast food restaurants can do to cut costs in Germany aside from the order touchscreens and such.
Excerpt about additives:
Believe it or not, big name food brands often adjust their ingredients in European countries compared to their products released in the United States. Certain ingredients that are illegal in Europe are still allowed, and commonly used, in the United States. The following eight common ingredients are approved in the U.S. but banned by the European Union or select European states.
-
rBGH (rBST)
- Common foods: Milk and yogurt
- Purpose: Injected into cows to boost milk production
-
Ractopamine
- Common foods: Pork, beef, and turkey
- Purpose: Increases lean muscle near the end of an animal’s life
-
Potassium bromate (bromated flour)
- Common foods: Hamburger and hot dog buns, and packaged baked goods
- Purpose: Makes bread fluffier and whiter
-
Brominated vegetable oil (BVO)
- Common beverages: Sports drinks and sodas
- Purpose: Keeps flavor from floating to the surface
-
Olestra
- Common foods: Fat-free chips
- Purpose: Substitutes fat
-
Azodicarbonamide
- Common foods: Frozen dinners, pasta mix, and packaged baked goods
- Purpose: Bleaches flour rapidly
-
Coloring agents (Red #40, Yellow #6, Yellow #5, and Blue #1)
- Common foods/beverages: Cake mix, candy, soda, and sports beverages
- Purpose: Changes food color
-
BHA and BHT
- Common foods/beverages: Gum, cereal, vegetable oil, butter, and beer
- Purpose: Makes food last longer
And these additive ingredients expand past the EU into the United Kingdom. For example, the American version of Kraft Macaroni and Cheese is entirely different from Kraft’s “Cheesey Pasta” sold in Great Britain. Take a look at the differences below.
-
Maybe it’s location based, but I had a mcflurry about a year ago and was given a pathetically small amount of the topping poorly mixed in a terrible filler ice cream. Perhaps the ice cream in the mcflurry was always terrible, but I hadn’t noticed it before when I would get a lot more of the topping. Also, their coffee was better for a time but it has reverted to burnt mud.
Majority of McDonalds locations are franchised so quality varies widely.
Quality of food is determined by McDonald’s as they control the supply chain. Quality of prep vary by location
Somehow I don’t think you’re getting a McAloo Tikki Burger, or a Spicy Paneer Wrap outside of India McDonald’s.
Their menu definitely changes depending on the country.
According to economic theory, “when price exceeds value.”
Apparently quite a few people have a high tolerance for what they value.
“Perceived value”
Without that element, there would be no explanation for Marketing other than pure Brand Awareness promotion working (and McDonalds is definitely beyond needing more Brand Awareness, at least in the Developed World)
Even then, it doesn’t explain a lot of how Marketing does its work (namelly the stuff they took from Psychology and use to do things like create associations between brand and specific feelings on people’s subconscious - you know, the way cars are “freedom” and perfumes are “sex”).
And don’t get me started on other techniques that prey of human cognitive weaknesses (for example, FOMO would not work with the fabled Homo Economicus that underpins so much of Free Market Theory)
Anyways, a ton of present day enshittification (and that includes this kind of price inflation) relies on people having a well entrenched positive perception of a brand after years of having a relationship with it (i.e. chosing it as customers) and there being quite a lot of momentum behind it. It also relies a lot on using a “slow boiling” effect to keep people from spotting the full picture of the changes.
These figures should be inflation adjusted
Also why no big Mac?
2014 $5.39 inflation adjusted to 2024 $7.18
Agreed, but only if wages and especialy minimum wage was inflation adjusted
They should also compare shrinkflation. If a burger price rises by 25% but it’s size shrinks by 10%, the cost is much higher as you’re paying more for less.
Sooooo, stop eating there? It’s expensive enough bowing to the grocery cartels, who can afford to eat out?
Beat meat to it.
Also nice username.
Yet another reason to stop eating there
You mean providing a photo opportunity for a billionaire to roleplay being a poor to help him get elected wasn’t enough to get progressive to boycott them? I think that’s much more actively politically involved than Hobby Lobby or Chic Fil A.
I can blame McDonald’s for a lot of things, but not this. They didn’t really get a choice.
God I wish that plane went down
Mildly infuriating is +122% being the largest bar graph and +199% is the smallest.
Except for the left side, the bars are proportionate to price in dollars. The percent increase that amounts to is marked above the bars, and that number should match up to the visual difference between the 2014 price and the 2024 price, compared to the 2014 price alone.
The 3 yellow bars on the left are nonsense and seem to have been drawn like that just to fit that picture of the girl in.
Think about people working there.
They want a living wage at least.Would be nice to see a graph of inflation-adjusted wages at McDonalds between 2014 and now.
I don’t have the data, but I doubt much of this price increase is going into worker’s pockets. It’s profit for CEOs and shareholders.
Is that why you think prices went up?
Don’t eat fast food, make your own.
If you’re already at home it’s faster too.
Is that little girl in the picture to blame?
The two inflation calculators that I found said that a dollar in 2014 should be worth $1.33 in 2025. That’s significantly lower than the lowest price increase in this infographic.
Also most of that inflation was the last few years, driven mostly by corporate greed. Not from rising company expenses.
What’s actually infuriating are those bar charts.
And McDonald’s countered with a statement Pricing Myths vs Facts where they compared 2019-2024 prices where the original study the infographic is based on compared 2014-2024 prices. A little FUD seasoning if your will to make it all look less bad.
That’s the same company that countered their wages being too low to live on by producing an example budget to show how you can survive with only a McDonald’s job. The first line in the budget is income from the first and second job. They costs are even more laughable today.
This is also the same company that put out a sample “budget” to show how you can live off a McDs salary. Oh, assuming you didn’t turn the heat on.
I don’t see anyone mentioning the proportions of the bars. For example, on the 1st item for example, $1 vs $2.99 is not even double the size…
Hah! That’s a very good point. Why make a bar chart if it’s not even showcasing the correct values, which in this case actually helps the message?
At first, I was assaulted by the percentage representation. Then I cooled down and thought, it’s not the percentage, but those bars are the absolute height of the price! Me smart, until I took a look again and now my hate is burning so, so hard for this graph. It is designed to enrage.
They’re not. The $3 bar is not 3x the height of the $1 bar next to it. The $2.99 bar on the right is higher than the $2.99 bar on the left. Someone just free drew the bars and it’s extremely noticeable and annoying.
They borked their graph to make room for the picture of the girl for some reason
I think they scaled them in proportion to their group.
Remove one entire group (e.g. 2014) and I think you will see it.
Not sure what you mean. The McChicken bars are not showing a 200% increase regardless of how you slice it.
The graph is fucked btw. Read the values its different than the bars. Also a gaph like this should set the starting point for everything on the same level and only show the change not how much it changed by. You could put a car on this graph and shiw how its price increased by 100$ which would blow out all the other data even though its price only changed by 1% for example.
Also doesn’t site source or state units
$ is used by many currencies, is it AUD?
Chilean Pesos
Ahh the one us cent meal
Yeah I’d be curious to see a graph with inflation accounted for.
You might say the graph itself is “mildly infuriating”
Yeah very poorly done
Plenty small restaurants have not seen price increases this stark over this period of time. Eat there instead.
More reason to stop eating fast food.
Did the UK Lib Dems make this bar chart?
I don’t understand the insinuation you’re going for. Care to explain?
The Liberal Democrats in the UK are infamous for their dodgy bar charts in election leaflets, where the percentages don’t match up with the bars at all.
Similar to this:
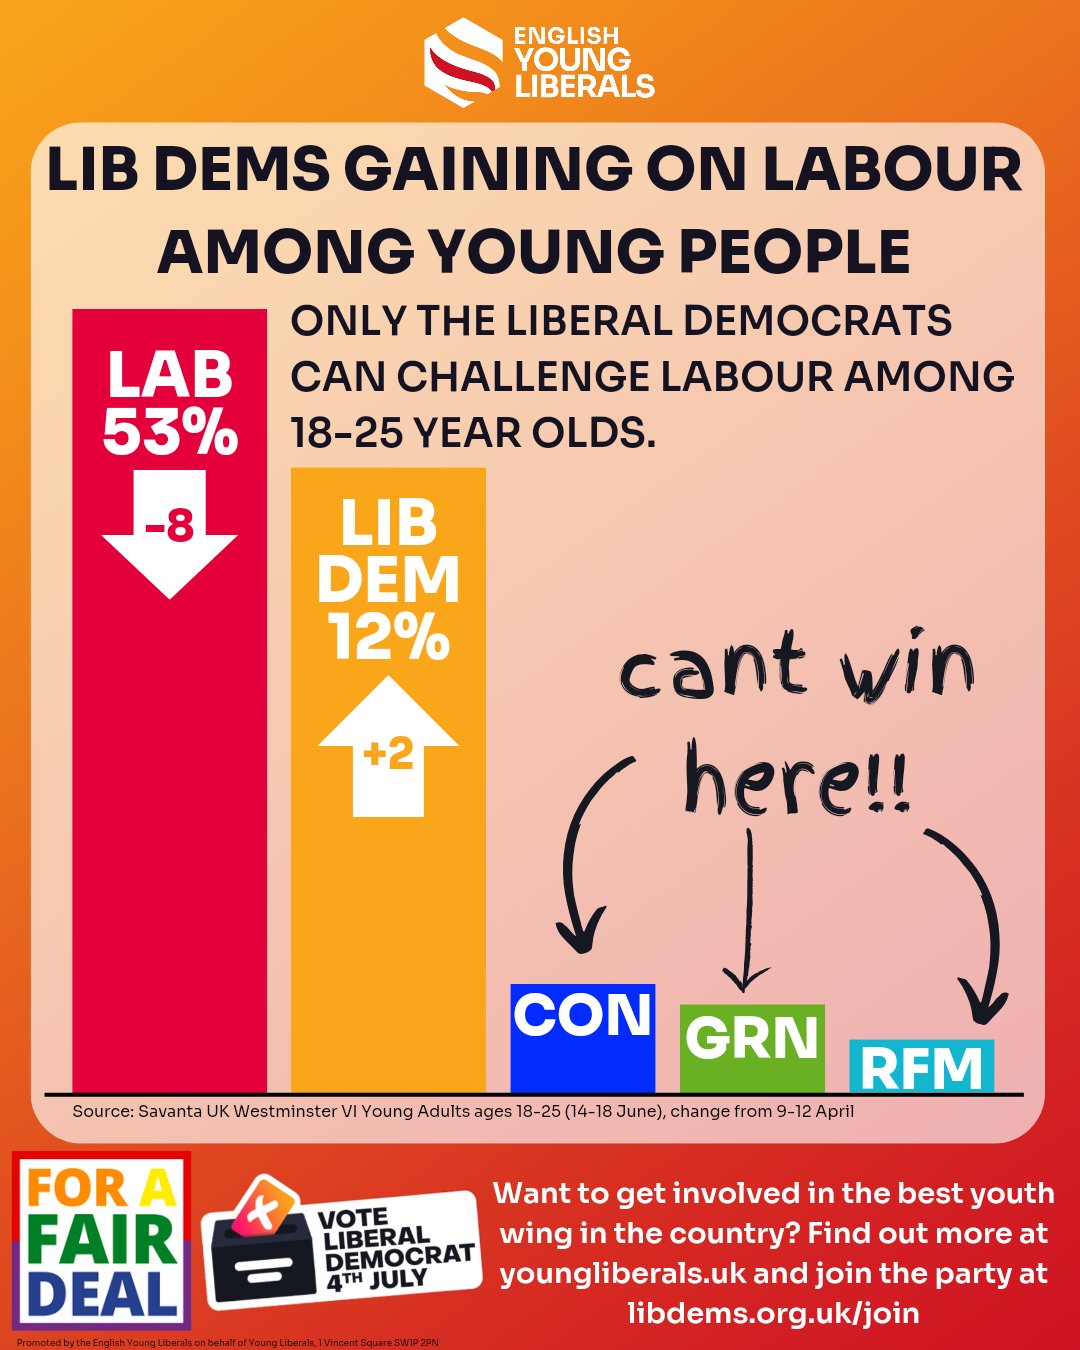
It’s a running joke in the UK.


