

0·
21 days agoOoo like higher powered rfid tags! The info could even then be relayed to the driver via the on screen display since theyre now all required.
Ooo like higher powered rfid tags! The info could even then be relayed to the driver via the on screen display since theyre now all required.
Many kinds yes, idk enough to say all. Docs take a sample of the cancer DNA, turn that into an mRNA vaccine, inject it into you, and your immune system precisely destroys the cancer.
It seems interesting for many cancers, and lifesaving for already metastasized cancers.
Only downside will be lifelong wage garnishment to The Company.

+1 for syncthing.
Always get the version of the gadget with replaceable batteries unless you want a brick in 3-10 years. Additionally, prefer 18650, AA, AAA batteries, and keep some rechargeable ones around.
It’s not the biggest, but it still is a concern, and is exceedingly easily mitigated.
For privacy.com:
On credit freezes:
My favorite was the password set screen allowing up to 64 characters, but login fails if the password is over 32 chars.

The choice paralysis is real. I chose lemm.ee because it was easy to type into the address bar, and I’ve stuck around because the admin seems pretty level-headed.
Idk if you can transfer likes comments and posts, but you can go to your old account from a new one and star everything with the new account pretty easily. So that at least can transfer.
Beside the point, but this data visualization is misleadingly bad.
Eyes first draw to the heading, which primes us to think temperature. Then we see the graph, where the unlabeled Y axis is assumed to be average night temperature. Finally, we read the subheading and it says that the Y axis is not temperature, but counts of days over a certain temperature.
I think that this metric is more useful than “avg. overnight temp.”, but please label axes.
Also, it would help to rephrase the subheading to use “80” since that’s obviously the cutoff. I spent a moment wondering what was special about 79F.
And now I see that this was made by the NYT. I guess they’re pumping out charts (maybe automatically) and thinking more about making them pretty than legible.

What was the book?

Ok, that’s what I’ll do. Thanks so much for the info! 😁
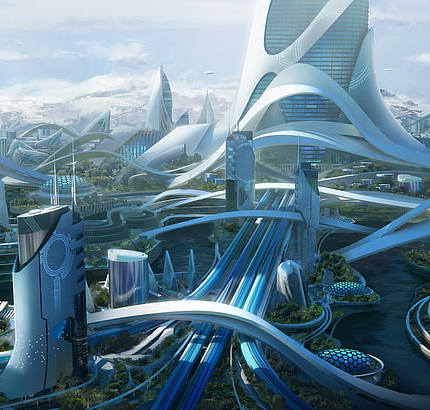
The world if metric began in base 12:
I have a friend who argues that “it’s just as good, there’s no difference really”. Then we go camping and have to do a unit conversion on how much water to boil and it takes 2 minutes and a phone calculator.
I had to check the math because 1 m2 being 2300 kg while 1 cu ft at 143 lbs seemed crazy, but with the volume difference it’s all correct.
Thank you for putting in the effort 🙃
You can translate those QR codes into the base seeds that were used to generate them. Then you can just save a text file with all those seeds. I’ve done it using a phone camera to open to a web browser and extracting the seed from the translated URL, but IDK if it can still be tricked into opening the code that way.
I hope this unasked for advice helps.
iMessage is encrypted in transit by default when talking to other iPhone users, and 95% of my contacts use iPhones. That is the ONLY reason I use an iPhone.
Only when they leak or get thrown out. If they’re still working they’re not leaking, but maybe drawing more power than needed.


Blue spray paint…